Gill Capital Partners Early-October 2025 Market Update

From the team at Gill Capital Partners, we hope this note finds you well! Fall colors are peaking, and we hope you can all take the opportunity to get outside and enjoy this beautiful time of year. This month, we have updates on several key economic fundamentals, including job and consumer data, inflation, interest rates, and the Federal Reserve. We will provide an update on the stock market and, of course, provide our views. Before we jump in, however, we’d like to provide a brief update on the government shutdown.
Government Shutdown
Here we go again! As of this writing, the U.S. federal government has shut down after a deadlocked Congress failed to reach a deal on funding. It seems like we experience a government shutdown nearly every year. In reality, there have been 21 shutdowns since the modern budget process began in 1976, many of which were just 1 or 2 days. Historically, furloughed employees have received back compensation once the shutdown ends. Why might this time be different? The Trump Administration is taking a different approach in negotiations, instructing agencies and departments to compile lists of non-essential workers and prepare for mass layoffs, not just furloughs, if funding is not secured. At issue is the deadlock in Congress over whether to pass a clean short-term funding bill or tie it in with extensions of healthcare provisions, such as Affordable Care Act premium tax credits and Medicaid restorations, which Republicans oppose. We do not know if this time is different or if it will be yet another in a long line of short-term funding showdowns that have been more noise than substance. That being said, we will continue to monitor this situation and keep you updated as it evolves.
Update on Economic Fundamentals
Turning to the recent reports on fundamentals, below are recent data points on jobs, consumer spending, inflation, and the Federal Reserve, as well as our views on the fundamentals.
Jobs & Consumer Spending – Below is a summary of the most recent data points on the U.S. labor market. We like to look at several sources of data to provide a comprehensive picture of what is happening in the labor market and what this may mean for the consumer, including reports from ADP, Challenger, Gray & Christmas, and the monthly BLS jobs report (which covers broad employment data, including government employment).
The most recent monthly jobs report, as released by the BLS, showed that the U.S. economy added only 22,000 jobs in the month of August, well below the consensus estimate of over 70,000 jobs. Additionally, the prior month revisions for June and July revised job growth lower by approximately 21,000 jobs combined over those two months. The unemployment rate rose to 4.3%. These monthly numbers are subject to revision due to the timing of reporting from both private and public employers, and it is common to see significant revisions.
ADP National Employment Report—The ADP report is a monthly look at private sector employment. For the month of September, private employers reported a rare negative reading, indicating that 32,000 private sector jobs were lost during the month. The August jobs report was also revised downward from a gain of 54,000 jobs to a loss of 3,000 jobs. This was far below consensus estimates, which called for over 50,000 jobs to be created in September.
Challenger, Gray & Christmas Layoff Tracker – The layoff tracker is a monthly report by Challenger, Gray & Christmas, an executive outplacement and career transition firm, that compiles the number of job cuts announced by U.S.-based employers and has been published monthly since the 1990s. Employers announced 85,979 job cuts in August 2025, a 39% increase from July. Total year-to-date layoffs now stand at 892,362, marking the highest number through August since 2020, a 66% increase from the same period in 2024.
Consumer spending – Personal Consumption Expenditures (PCE) rose 0.6% in August, while retail sales also rose 0.6% in August. This suggests that the consumer is still holding on despite weakness in the labor market.
Our view
As shown in the chart below, the past few months clearly show a weakening labor market. Looking more closely at the data, if not for the healthcare and social assistance categories, which created all of the jobs over the past couple of months, the U.S. economy would have lost jobs each of the past three months.
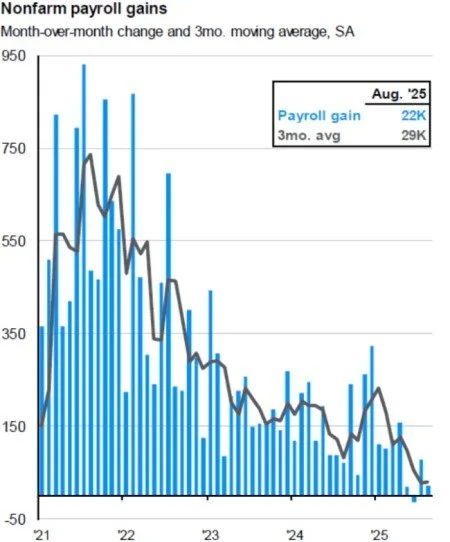
The U.S. labor market is clearly softening, as evidenced by the chart above, which shows that monthly nonfarm payroll gains are barely positive on a month-over-month basis. Examining multiple angles of the labor market, there is no sugarcoating the reality that the U.S. labor market has decelerated, which directly led to a recent interest rate cut by the Federal Reserve, as it is concerned about the recent labor market developments.
So, how is consumer spending data holding up, given a weakening labor market? While it is clear that the labor market has weakened, and unemployment has risen to 4.3%, the current level of unemployment remains well below the 50-year average of 6.3%. For the moment, wage growth, which was recently reported at 3.8%, just barely above the current inflation rate of 2.9%, is supporting household spending. Furthermore, the so-called “Wealth Effect,” which is generally derived from stock market and housing values, remains strong. Households with financial assets feel wealthier and are more willing to spend, even if wages are only modestly outpacing inflation. Finally, credit card balances are currently at record highs, a sign that consumers are increasingly using credit to maintain their spending.
Inflation – The monthly report on consumer prices (CPI) for August showed that prices accelerated more than anticipated, with the CPI increasing 2.9% from the same month a year ago and 0.4% for the month. Core CPI, which excludes food and energy prices, increased 0.3% for the month and 3.1% from a year ago.
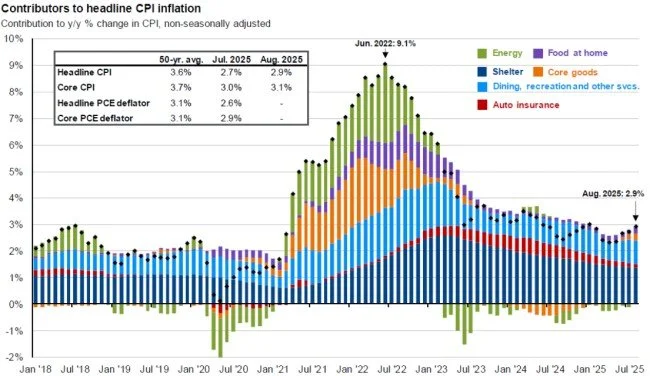
Our view – Consumer prices increased last month, driven largely by higher energy, food, and shelter costs, as the impact of tariffs continues to settle through the economy. As shown in the chart above, this was the fourth consecutive monthly increase and remains above the Federal Reserve’s target of 2%. The data continues to put monetary policy experts in a very difficult spot as they wrestle with labor market weakness and how to balance their dual mandate. While 2.9% inflation would be classified as moderate inflation as opposed to runaway inflation, it remains above their long-term target.
Interest Rates & The Federal Reserve - At its August 2025 meeting, the Federal Reserve cut its target federal funds rate by 25 basis points (0.25%), bringing the range down to 4.00%-4.25%. This was the first rate cut since December 2024. The decision was not unanimous: one member, Stephen Miran, who was recently appointed by President Trump, dissented, preferring a larger 50-basis-point cut. Alongside the rate decision, the Fed released its summary of Economic Projections, showing where participants expect key variables and policy rate to go. Key projections include:
GDP Growth for 2025 is projected to be 1.6%.
Unemployment will continue to rise modestly to 4.5% by the end of 2025.
Inflation will rise to 3% by the end of 2025 and then decline to 2.6% in 2026.
An update of policy projections, also known as the “Dot Plot,” suggests additional rate cuts through 2025, with the projected federal funds rate at approximately 3.6% by the end of the year.
Our view
The Fed currently finds itself in a very difficult position, with its two mandates (maintaining stable prices and full employment) appearing to be moving in opposite directions, potentially creating risks on both sides. As stated after the last meeting by Federal Reserve Chair Jerome Powell, “Near-term risks to inflation are tilted to the upside and risks to employment to the downside — a challenging situation. Two-sided risks mean that there is no risk-free path.”
To complicate matters further, the Fed is facing political pressure from the Trump administration to cut interest rates more quickly. The newly appointed Federal Reserve Governor, Stephen Miran, was the lone vote of dissent, pushing for deeper cuts, while 11 other members of the FOMC voted for a 25-basis-point cut. With two meetings between now and the end of the year, markets and investors are sure to evaluate every data point and commentary coming out of the Fed for clues as to which side of the mandate will drive Fed policy going forward.
Equity Market Update – As of this writing, U.S. equity markets have continued to rally and are at or near all-time highs, with the S&P 500 up 13.3% for the year. International markets continue to lead the charge, however, with the MSCI EAFE International Index up 22.9% and the MSCI Emerging Markets Index up 27.1% this year.
Our view – The equity markets are having another strong year, and if this trend holds, it will mark three consecutive years where the S&P 500 is up over 10%. As shown in the chart below, valuations have reached fresh 25-year highs, with P/E ratios approaching 23 times. Only during the late 90s tech boom did we see higher valuations that peaked just over 24 times.

So how do U.S. equity markets continue to push higher, given a weakening labor market and historically high valuations? Several key dynamics help explain this. First, corporate earnings have generally been good, particularly in tech, with AI spending driving an entirely new industrial revolution. Second, AI and automation are just beginning to filter through businesses and efficiency is skyrocketing as a result, which is bad for the labor market but good for businesses. Finally, as discussed above, the Federal Reserve is cutting interest rates, and the market is anticipating further rate cuts. Lower interest rates are generally supportive of stock prices. All of that being said, while we love the stocks in the S&P 500, we remain disciplined, which means diversification and rebalancing. Our portfolios comprise market weights of small, medium, large, and international stocks, not just the top tech stocks that often make headlines (we own those too, by the way). Interestingly enough, in the third quarter, the best-performing asset classes were small-cap U.S stocks, followed by emerging markets, where valuations are dramatically more attractive, yet you do not hear anybody talking about them. This makes a strong case for diversification across asset classes. We will continue to update you as developments occur.
As always, please let us know if you have any questions or concerns, or if we can provide assistance with any other financial planning matters, including education, taxes, insurance, or estate needs.