2011 Market Summary
Perspective: 2011 Year in Review
2011 was either a very disappointing year or a surprisingly positive year depending on your point of view. The reasonably robust equity bull market of 2009-2010 didn’t appear to be weakening as we began the year, and indeed the market came out with a reasonably strong first half. But weakness in May and June led to a full fledged rout in August and September (driven by uncertainty in Europe), only to be saved by a startling rebound in October. Overall the domestic equity markets ended flat (large caps) to down a few percentage points (small cap). Not so in the international equity markets, as the third quarter rout was even more severe and the fourth quarter rebound not quite as robust, leading to significant losses in most regions and countries. On the other side of the coin, most of our domestic fixed income managers entered 2011 with very modest expectations, yet the Barclays Aggregate was up nearly 8% and the Barclays Treasury Index nearly 10%. So what went as expected in 2011 and what did not?
At the end of the year, there was significant concern among our managers that the extended rally from the March 2009 lows had pushed too many of the marginal companies (those with lower S&P ratings) too high at the expense of higher quality companies. This did eventually play out, as the higher quality companies held up better during the sharp selloff over the summer, and recovered better over the course of the fourth quarter. These companies were marginal beneficiaries of the risk on/risk off mentality that was so pervasive over the course of the year. On the international side, our managers were concerned at the end of 2010 that the emerging markets in particular were priced to perfection after a big run in 2010. Even with this caveat, most of our managers still believed these markets to have the best upside potential, given the lack of growth prospects in developed Europe and Japan. A stronger dollar, significant impact from the Euro crises and the aforementioned high valuations led to significant losses in most emerging markets during the year, with Japan and Europe also showing double digit losses.[1]
On the fixed income side, the domestic market entered the year much the same as it entered 2010, with very low current Treasury yields, expectations for rising rates during the year, and very low expectations for total return. But, the European debt crisis (and subsequent flight to Treasuries) and the Fed’s Operation Twist in the third quarter drove rates substantially lower in 2011, particularly in long term bonds. The Barclays 20+ Year Treasury Index was up nearly 34% for the year, just about the opposite of expectations back in January. The U.S Municipal market was rocked during the final month of 2010, as several macro events flooded the market with supply just as investor confidence reached a low. Municipalities rushed to market in November and December when it became clear that the Build America Bonds program would end at the end of the calendar year. This was coupled with a late surge in borrowing from California as the state’s budget debate was delayed into the fourth quarter. All of this supply came to market just as Meredith Whitney went on national television warning of billions of dollars in defaults in the municipal markets. Not only did Ms. Whitney’s forecast not come true, but the muni market bounced back in the final three quarters of the year to post a nearly 11% return.[2]
The overwhelming impact of the year both in the fixed income and equity markets was the (still) ongoing uncertainty of the European Debt crisis. Markets around the world were glued to every minor announcement from Germany, France, the ECB and from Greece itself over the fate of Greek debt and the overall health of the Euro. The wild rollercoaster appears headed for another loop around the track, as virtually no major issues were solved in 2011, and the uncertainty, and its impact on global markets, remains.
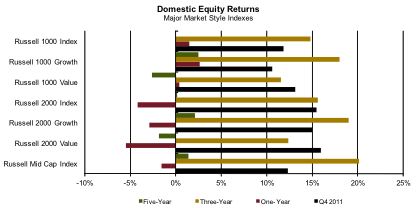
Domestic Equity Markets Overview[3]
After a truly dismal third quarter, the domestic equity markets bounced back strongly in October, then, with high daily volatility, held mostly steady during the final two months of the year. Small caps generally outperformed larger caps, with the Russell 2000 Index up 15.4% and the Russell 1000 Index up 11.8%. Despite the outperformance in the final quarter the Russell small cap indexes all posted negative returns for the year (as did the midcap indexes), while the large cap indexes had marginally positive gains for 2011. The value style indices outperformed the growth indices for the quarter based on a strong showing in the final month. This was a result of strong performances in the Health Care and Financials sectors during December in the Russell 1000 Index, and a strong showing in Financials and Utilities in the Russell 2000 Index. In both large and small caps, Energy and Materials were down significantly in the final month. Despite the rebound in the markets, investors continued to move away from domestic (and international) equities in favor of higher fixed income allocations. Morningstar estimated fund flows for the fourth quarter (through November) show nearly $29 billion in outflows from domestic stock funds and $7 billion from international equity funds.[4]
As we noted in this space last quarter, many of our managers have been emphasizing stocks with higher dividend payouts as a cushion against higher volatility. This continues to be the case as we move into 2012, one of the big supports for Financials, Staples and Utilities, the quarter’s best performers. There is also a bias among our managers (that have some flexibility) toward large cap names, based on both current fundamentals and long term exposure to emerging market economies. Over the past five years, through the end of 2011, the average annual returns on the Russell 1000 and Russell 2000 are both near zero, -2 basis points for large caps and plus 15 basis points for small caps. This has left the larger cap names, even after outperforming in 2011, cheaper on a P/E basis. The two most commonly mentioned risks in the domestic equity market are the current level of corporate profits and the continuing uncertainty surrounding the fiscal stability of the Euro and a potential recession in that region. Corporate profits and profit margins are running at or near record highs, a situation that by definition can’t continue indefinitely. Indeed, nearly 20% of the S&P 500 companies revised their fourth quarter earnings guidance downward, the largest such number since 2001.[5] At some point, though not necessarily in 2012, the market will be forced to pare back its earnings growth estimates, and even with no margin compression, market prices will likely come down. The second issue, Europe, has been driving the day to day volatility of the equity market for most of 2011, and will likely continue to do so through the first half of 2012. Oddly, the actual impact of a European recession would likely be very limited in terms of U.S. GDP growth, given only 2% of GDP is traded with Europe and 8% of S&P 500 profits come from Europe.[6] Of course a full scale default in Greece, or more importantly Italy, would have a long reaching impact.
International Markets Summary[7]
As with the domestic markets, the International and Developed markets rebounded from the significant losses in the third quarter. However, for most of the regions, the rebound was decidedly less enthusiastic than here in the U.S. Combined with larger losses than the U.S. in the third quarter, it placed most of the regional returns in negative territory, well behind the U.S for the year. The Russell Developed ex North America Large Cap Index was up just 3.31% in dollar terms during the fourth quarter, and was down 12.4% for the year. In dollar terms, only Ireland (represented by the Russell Ireland Index) outperformed the U.S. up just over 22% for the final quarter and up nearly 14% for the year. In fact, despite all of the headline issues around the European debt crisis, the European markets held up very well during the quarter (in dollar terms), with Norway (+9%), the U.K. (+9%) and Denmark (+8%) leading the way. As has been the case for more than a year, the countries at the center of the debt crisis were some of the worst performers, with Greece down another 27% in the quarter and Portugal down more than 9%. The Asian markets were broadly mixed, with strong returns from emerging countries such as Malaysia and Thailand, offset by weakness in Japan and New Zealand. Among the emerging economies, the Latin American region did the best, with Peru (+12%), Mexico (+9%) and Brazil (nearly 9%) leading the way for the quarter. Of the significant emerging economies, only Indonesia had a positive return for the year.
The managers we spoke to this quarter continue to believe the emerging markets space has the best long term potential, but one that also has some hurdles to overcome after a disastrous year. The question marks remain to what extent the continued slow growth in the global economy (or even a contraction in Europe) will soften demand for exports and to what extent that demand can be made up by local market participants. Several managers are focusing on domestic consumer oriented companies, whose products are sought after by the growing middle class and affluent consumers.
Fixed Income Summary [8]
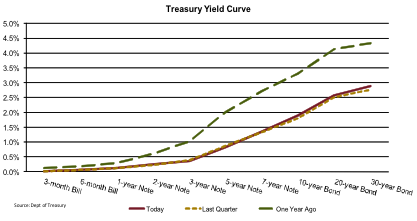
What appears on paper to be a relatively boring quarter, with the Barclays Aggregate Index up 1.1%, was actually anything but. Although the Treasury curve (seen above) ended the quarter with only small changes from the previous quarter end, the changes during the quarter were relatively substantial. After the dramatic flight to quality and sharp drop in the long end during the third quarter, the “risk on” trade came back into favor in October, and the spread sectors rallied while the Treasury market slumped. Yields on the 10-year Treasury jumped more than 50 basis points before the end of October. This move quickly reversed itself in November, as continued uncertainty in Europe swamped relatively positive news domestically. Treasuries rallied and the Barclays Corporate Index gave back all of its October gains before the end of November. December was much quieter, and a combination of demand for Treasuries and cautious economic optimism allowed all the major sectors to record positive returns for the month.
As we enter 2012, the domestic fixed income markets are in a very similar position as the two previous years. The Barclays Aggregate Index was up 9.5% in 2009 and 7.1% in 2010, following both of those showings the consensus forecast was for nominal to improving GDP growth and a higher probability of higher interest rates before the year was over. Most of our managers hoped to keep their coupon income in both years, looking for very nominal 1.5%-2.5% total returns, and the fear of rising interest rates kept most managers at or short of their typical duration targets. Going into 2012, there is again a consensus for nominal, improving GDP growth, though no thought of a rate increase from the Fed. And while the majority of the managers we spoke to remain more conservatively positioned (shorter durations, higher quality), there is an increasing minority calling for longer duration positioning. This minority concludes that rates are likely to be range bound over the short to intermediate term, and the increased income available with longer maturity instruments is worth the interest rate risk.
Similar to the investment grade sector, the domestic high yield sectors saw significant swings in the first two months of the quarter, before settling down in December. Unlike the taxable market the losses in November were significantly smaller than the gains in October, allowing the Barclay’s High Yield Index to return nearly 6.5% for the quarter, and the High Yield Loans Index was up 3.1%. These gains allowed both indexes to have positive returns for the year, 5.0% and 1.1% respectively. As noted last quarter, high yield spreads remain relatively wide (OAS on the Barclays High Yield index ended the year at 699bps) compared to defaults on a trailing 12 month basis. Our managers continue to believe the asset class offers an attractive risk/reward profile, even if default rates begin to rise.
The Municipal market closed out its year with the best return of the broad investment grade indexes, with the Barclays Municipal Index up 2.1%, outperforming the Barclays Corporate Index by 20bps and more than doubling the return of the Barclays Treasury Index. This capped the year at 10.7% for the Index after a weak start in the first quarter of the year. The Municipal Index has returned more than 10% only twice in the last 15 years: 2000 and 2009, both years following 2+% losses in the Index. Despite the substantial returns, many of our managers believe the muni markets offer significant opportunities entering 2012, as the yields on AAA municipals are higher, on a pre-tax basis than Treasuries across the curve, with the exception of the 10 year[9]. Add in modestly improving state and local budgets (generally), and new issuance expected to be lower than the 5 year average, and even our taxable managers are making a case for adding municipals to their portfolios.
Outlook
Our primary comment from the end of the third quarter remains: As long as the sovereign debt crisis in Europe remains unresolved, the pressure on global equity markets will remain on the downside, despite the fundamentals. The U.S. equity markets will also have to deal with the impact of the 10 month long Presidential campaign, which is just warming up, very high expectations for earnings and will need to find a way to attract back the nearly $75 billion in assets that flowed out during the first 11 months of 2011.[10] The domestic fixed income market enters its third consecutive year with low expectations given the very low current yields in both taxable and municipal markets. For 2012 the biggest difference is there is no expectation of a Fed movement for at least a year, if not more. Absent another “flight to quality”, and quite possibly even with one, Treasury yields are likely to remain tightly range bound during 2012, leaving only the possibility of small capital gains in addition to interest income.
Intended for investment professional use only.
This commentary is not intended as an offer or solicitation for the purchase or sale of any security or other financial instrument. It is based upon information that Gill Capital Partners considers to be reliable but we do not warrant its accuracy or completeness. Assumptions, opinions and estimates constitute our judgment as of the date of this material and are subject to change without notice. Neither Gill Capital Partners nor its affiliates are responsible for any errors or omissions or for results obtained from the use of this information.